130 features14 areasESG platform and three add-on modulesA selection of the core functions
Frequently asked questions
Questions we get asked again and again in demos. One click shows the features that answer them.
130 of 130 features
Frequently asked question
Data collection11
From fuel receipt to survey: every route leads into the same footprint.
Sprinter-1Fuel_receipt_10-2026.jpg
Read by Todd AI
124
Liters
10/2026
AcceptCorrect
0.33 tCO₂eafter your approval
Data collectionESG platform
Todd AI reads quantity and unit from the invoice or receipt and checks it against the selected period. Nothing is saved until you have checked the value.
Upload an invoice or fuel receipt. Todd AI reads the value.
Todd AI reads quantity and unit from the invoice or receipt and checks it against the selected period. Nothing is saved until you have checked the value.
Survey · Commuteanonymous
How do you get to work?
Car46%
Train32%
Bicycle22%
28 of 42responses in 3.7 Commuting
Data collectionESG platform
You collect commutes and business travel via survey. The responses produce patterns that you apply to the category.
Set up a survey per category
Responses pseudonymized
For ESG, site teams
Data collection
Surveys for commuting and business travel
Employees answer on their phones. Names stay hidden in the analysis.
You collect commutes and business travel via survey. The responses produce patterns that you apply to the category.
Sprinter-1
124 l diesel0.33 t
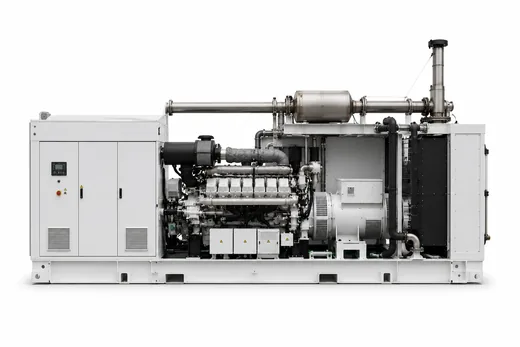
CHP unit hall 2
41,250 kWh8.25 t
Forklift 2
310 l diesel0.83 t
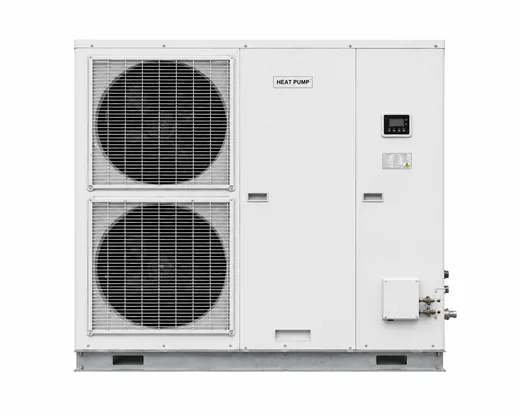
Heat pump
1.2 kg R-320.81 t
Data collectionESG platform
You set up vehicles, heating systems, CHP units and refrigeration systems as assets, with image, site and collection method.
Tile or list view
Heating systems, CHP units and refrigeration systems can also be created in bulk from a file
Method, documents and comments visible per entry
For site teams, ESG
Data collection
Assets, fleet and refrigerants
Set up each asset once. After that, only record consumption.
You set up vehicles, heating systems, CHP units and refrigeration systems as assets, with image, site and collection method.
Electricity Q3 · Hamburg plant
86,400kWh32.8 tCO₂e
Invoice_Q3.pdfEvidence
Data sourceInvoice
Data qualityhigh
Data collectionESG platform
Invoice, contract or meter photo are attached directly to the entry. You also see how robust the value is.
Data source and note per entry
Data quality per category in the analyses
Traceable for reviewers without searching
For ESG, controlling, site teams
Data collection
Evidence and data quality per entry
The receipt is attached to the value. The data quality sits right next to it.
Invoice, contract or meter photo are attached directly to the entry. You also see how robust the value is.
The screening guides you through all 15 Scope 3 categories. You record which ones are material and why the others are not.
Start directly at the sites
Justification is documented
Basis for your reporting boundary
For ESG
Data collection
Scope 3 screening
Which of the 15 categories are material for you?
The screening guides you through all 15 Scope 3 categories. You record which ones are material and why the others are not.
Business travel · Scope 3.6
Flight · Business1.84 t
Train0.06 t
Rental car · Mid-size0.21 t
Hotel · 3 nights0.05 t
2.16 tfrom four trips
Data collectionESG platform
For business travel, you choose the mode of transport and enter the distance. Flights are split by class, cars by size and drive type, hotels by country and nights.
Flight classes from Economy to First, nine car segments
Hotel nights per country
Calculation method per mode of transport
For ESG, site teams, controlling
Data collection
Business travel assistant
Flight, train, rental car or hotel: every trip with the right factor.
For business travel, you choose the mode of transport and enter the distance. Flights are split by class, cars by size and drive type, hotels by country and nights.
Truck · Refrigerated transport12 t · 480 km · Load factor 80%
Distancet·kmFuelSpend
0.69 tScope 3.4 · per tonne-kilometer
Data collectionESG platform
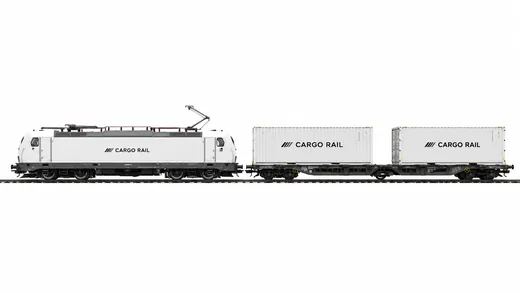
You record transport by distance, tonne-kilometers, fuel or spend. You add load factor and refrigerated transport; storage has its own route.
Upstream and downstream logistics (Scope 3.4 and 3.9)
Factor per tonne-kilometer
Storage as a separate item
For ESG, procurement, site teams
Data collection
Freight and storage
Truck, rail, ship, air freight and warehouse, refrigerated too.
You record transport by distance, tonne-kilometers, fuel or spend. You add load factor and refrigerated transport; storage has its own route.
For each of the 15 Scope 3 categories there is a dedicated collection route, with the inputs that fit the category. Per site, you only activate what is material for you.
Upstream energy, waste and leased assets
Use and disposal of sold products
Franchises and investments
For ESG
Data collection
All 15 Scope 3 categories can be recorded
From purchased goods to investments: every category has its route.
For each of the 15 Scope 3 categories there is a dedicated collection route, with the inputs that fit the category. Per site, you only activate what is material for you.
Data quality · Electricity
Level 1Primary data90%
Level 2Average data5%
Level 3Estimated5%
90%of entries from primary data
Data collectionESG platform
Every entry carries a quality level, from primary data to estimate. Per category, you see how the entries are distributed.
Level from the data source: meter reading, invoice, manufacturer data
Distribution per category
Shows where better data pays off
For ESG, controlling
Data collection
Data quality in three levels
How robust is the category? The distribution shows it.
Every entry carries a quality level, from primary data to estimate. Per category, you see how the entries are distributed.
Responses · Commuting
Commute 18 km/dayplausible
Commute 540 km/dayexcluded
Over 500 km a day: probably an input error.
1 of 28responses excluded
Data collectionESG platform
Survey responses run through fixed plausibility rules. Anything unusual is excluded and counted instead of flowing into the footprint.
Rules per topic, such as a commute over 500 km a day
For ESG, site teams
Data collection
Plausibility check for surveys
A 540-kilometer commute every day? That doesn't count.
Survey responses run through fixed plausibility rules. Anything unusual is excluded and counted instead of flowing into the footprint.
Survey templates
CommutingTravelFleetElectricityHeatWasteFreight+4 more
11 templateswith preview before launch
Data collectionESG platform
For eleven topics there are ready-made survey templates. You upload the recipient list as CSV and see before launch how the survey looks on phone and desktop.
Commuting, business travel, fleet, electricity, heat, waste, freight, rented properties
Consent text on every form
The responses produce suggestions that you apply to the category
For ESG, site teams
Data collection
Survey templates for eleven topics
Not just commuting: fleet, electricity, heat, waste, freight and more.
For eleven topics there are ready-made survey templates. You upload the recipient list as CSV and see before launch how the survey looks on phone and desktop.
ERP import11
An ERP export becomes entries in your footprint, with preview, clarification and protection against double counting.
XLSXERP-Export_Q3.xlsxread
Account 6400Natural gas · Scope 1
CC 4100Hamburg plant
100-5120Round steel C45
3 duplicatesblocked
4 sitesbooked from one file
ERP importESG platform
Upload one export from your ERP. today.green assigns every entry to the right site, scope and category.
For every category there is a CSV template with the unit already filled in. Fill it in, upload it: today.green creates the entries in one step.
Download template
The third route alongside manual entry and receipt upload
For site teams, controlling
ERP import
Excel templates and CSV import
Many entries at once, with the template for the category.
For every category there is a CSV template with the unit already filled in. Fill it in, upload it: today.green creates the entries in one step.
Booking preview · 1,284 rows
0412Natural gas Marchwill be booked0413DieselDuplicate0419Round steel C45Decision needed0421Natural gas Aprilskipped
1,271 of 1,284rows will be booked
ERP importESG platform
The preview shows every row of your file with site, category, factor and result. A status tells you whether it will be booked, clarified or skipped, always with a reason.
Six statuses: will be booked, decision open, duplicate, skipped, confirm year, period locked
Before booking, you see what happens to every row.
The preview shows every row of your file with site, category, factor and result. A status tells you whether it will be booked, clarified or skipped, always with a reason.
Open decisions · 3
CC 4300Choose site212 rowsAccount 6795Choose category148 rows300-0417Choose factor52 rows
3 answersclarify 412 rows
ERP importESG platform
If the import doesn't yet know a cost center, an account or a material number, it asks once per key. Your answer applies to all rows and every future import.
Open decisions collected in one list
Only valid once you confirm
Confirmed answers are then stored in the mapping profile
If the import doesn't yet know a cost center, an account or a material number, it asks once per key. Your answer applies to all rows and every future import.
Import history
XLSXERP-Export_Q3.xlsxOct 14 · first uploadbooked
XLSXERP-Export_Q3.xlsxOct 21 · second uploadblocked
Document numbers checked1,284
0 rowscounted twice
ERP importESG platform
Every document number is booked only once, even if it already appeared in an earlier import. Repeats show up as a duplicate in the preview.
Every document number is booked only once, even if it already appeared in an earlier import. Repeats show up as a duplicate in the preview.
Quantities in the import
2.4 t2,400 kg12 pcs × 18.5 kg222 kg350 liter350 l40 m, no weightskipped
3 of 4converted, 1 skipped
ERP importESG platform
The import converts units: tonnes and grams to kilograms, pieces and meters via the weight from the material master. If the weight is missing, the row is skipped with a reason.
German numbers like 1.234,56 are read correctly
An empty quantity stays empty and is never booked as zero
Spellings like l, Liter and liter count as the same
Tonnes, pieces or meters: the calculation uses what is documented.
The import converts units: tonnes and grams to kilograms, pieces and meters via the weight from the material master. If the weight is missing, the row is skipped with a reason.
Steelworks North190 km · TruckProduction Hamburg
Delivery Oct 142.2 t round steel+0.042 t
Delivery Oct 281.8 t round steel+0.034 t
Scope 3.4arises with every delivery
ERP importESG platform
You set up the route from supplier to site once: mode of transport and kilometers. After that, every goods delivery on this route creates its own entry in Scope 3.4.
Truck, rail, ship or air
Fuels, electricity and own pickup create no second entry
Set it up once. Every delivery calculates its own freight.
You set up the route from supplier to site once: mode of transport and kilometers. After that, every goods delivery on this route creates its own entry in Scope 3.4.
Account 6530 · Diesel
Company carRule for this assetScope 1
Forklift 2Rule for this assetScope 1
Rented vanAccount ruleScope 3.6
1 accountthree correct assignments
ERP importESG platform
A specific vehicle or machine gets its own rule. It takes precedence over the account, so the same fuel lands in the right category.
Same diesel, two categories: company car in Scope 1, rental car in Scope 3.
A specific vehicle or machine gets its own rule. It takes precedence over the account, so the same fuel lands in the right category.
Goods receipt without weight
Product groupPurchase valueCO₂eElectronics€18,4003.97 tStandard parts€6,2001.69 tSeals€2,1500.59 t
6.25 tfrom €26,750 purchase value
ERP importESG platform
today.green calculates electronics, standard parts or seals via the purchase value. One rule per product group is enough, so parts without weight also flow into the footprint.
No weight, no material? Then the purchase value counts.
today.green calculates electronics, standard parts or seals via the purchase value. One rule per product group is enough, so parts without weight also flow into the footprint.
Booked · 1,271 rows
Hamburg plant312 t
Essen warehouse68 t
Frankfurt office41 t
Hamburg headquarters24 t
445 tacross 4 sites
ERP importESG platform
After the import, today.green shows the total per site and the entries per category. New material numbers and suppliers are then in your master data.
Jump straight to the site
Material master and supplier directory learn along
Over 60,000 emission factors from over 40 sources, available with every input.
For every entry, you choose from over 60,000 emission factors. In the import, today.green suggests the right factor.
My Data · Own factors
District heating, municipal utilityGrid_factor_2026.pdfactive
Round steel C45EPD · Steelworks NorthEPD
Database
0.280kg/kWh
Your utility
0.112kg/kWh
Factors & methodologyESG platform
You store your own factors and your suppliers' EPDs in “My Data”. They appear in the same selection as the database.
Factor from your utility or from an EPD
Usable in the import and in the bill of materials
For ESG, procurement
Factors & methodology
Own factors and supplier EPDs
Your utility or your supplier has better values? Store them.
You store your own factors and your suppliers' EPDs in “My Data”. They appear in the same selection as the database.
Scope 2 · Electricity 2026both methods
Location-based412 t
Market-based280 t
Guarantee of originon file
−132 twith green power and certificate
Factors & methodologyESG platform
today.green calculates electricity using both methods of the GHG Protocol. You store green power tariffs and guarantees of origin on the entry.
Location-based and market-based in the analyses
Reported dually in the report
For ESG, controlling
Factors & methodology
Scope 2 market-based and location-based
Both methods side by side. Green power with guarantee of origin.
today.green calculates electricity using both methods of the GHG Protocol. You store green power tariffs and guarantees of origin on the entry.
Base year 2024tCO₂e
Acquisition · +180 trecalculated
5%threshold for recalculation
Factors & methodologyESG platform
You set a base year. For acquisitions, new methodology or major corrections, today.green requires a recalculation or a justification.
Triggers to tick
In the report, you describe your recalculation rules
For ESG, controlling
Factors & methodology
Base year and recalculation
If your company changes, the comparison stays fair.
You set a base year. For acquisitions, new methodology or major corrections, today.green requires a recalculation or a justification.
Search refrigerants
R-410AHFC blendGWP 2,088
R-32HFCGWP 675
R-290Natural refrigerantGWP 3
2.51 tCO₂efrom 1.2 kg R-410A
Refrigerantsaround 160
Factors & methodologyESG platform
For air conditioning and refrigeration systems, you choose from around 160 refrigerants. The global warming potential comes from the list, and the refill quantity turns the leakage into CO₂e.
Search by name or substance family
Global warming potential (GWP) stored per substance
For fugitive emissions in Scope 1
For site teams, ESG
Factors & methodology
Around 160 refrigerants with global warming potential
Search the refrigerant, enter the refill quantity, done.
For air conditioning and refrigeration systems, you choose from around 160 refrigerants. The global warming potential comes from the list, and the refill quantity turns the leakage into CO₂e.
Search goods or services
Activity-basedSpend-based
Own factorsfirst
Metalsper kg
Plasticsper kg
980 goodsand 40 capital goods
Factors & methodologyESG platform
For purchased goods and capital goods, you search a catalog with thousands of items. A filter separates factors per quantity from factors per euro.
Filter by method and unit, with hit count
Your own factors are at the top
For Scope 3.1 and 3.2
For ESG, procurement, controlling
Factors & methodology
Goods catalog with method filter
Find the right factor for a product in seconds.
For purchased goods and capital goods, you search a catalog with thousands of items. A filter separates factors per quantity from factors per euro.
Market-based electricity factor
MethodContractual electricity mix
Wind60%
Hydropower25%
Photovoltaics15%
100%shares complete
Factors & methodologyESG platform
You build the market-based factor from your utility's value, the contractual electricity mix, certificates or the residual mix. The shares must add up to 100%.
Electricity mix from wind, hydropower, photovoltaics and more
Certificate share for guarantees of origin
Residual mix for the rest
For ESG, controlling
Factors & methodology
Electricity mix, certificates and residual mix
Four routes to the market-based electricity factor.
You build the market-based factor from your utility's value, the contractual electricity mix, certificates or the residual mix. The shares must add up to 100%.
Factor · Natural gasread-only
0.20kg CO₂e per kWh
SourceUmweltbundesamt, 2025
Published2025
ValidJan 1–Dec 31, 2026
CO₂CH₄N₂O
8.25 tfrom 41,250 kWh · CHP unit hall 2
Factors & methodologyESG platform
For every selection, today.green determines the factor automatically and shows it read-only: with source, publication and validity.
With factor ID and GWP version
Traceable for reviewers without follow-up questions
Map of your sites: every country with its sites and emissions.
The map shows every country with its sites and emissions, next to it the average per country.
Consolidation
Equity shareFinancialOperational
Demo GmbH100%Tochter Nord GmbH60%Kiel plantinherits 60%
1 approachapplies to every entity
Sites & structureESG platform
You choose equity share, financial or operational control once for the whole company. You maintain the ownership share per entity, sites inherit the value.
Ownership as a percentage or controlled / not controlled
The consolidated share is shown in the company map
You choose equity share, financial or operational control once for the whole company. You maintain the ownership share per entity, sites inherit the value.
For each request you define which methodology, data quality and evidence you require. The answer sits next to it: deviations are flagged before you approve.
Automatic check of quality level and evidence
History from sending through reminder to approval
Approving despite an anomaly remains your decision
For each request you define which methodology, data quality and evidence you require. The answer sits next to it: deviations are flagged before you approve.
The process map shows material, production and transport per product, with suppliers, inbound routes and the share of each stage.
PCF add-on module
Bill of materials · 214 componentsShare
Base frameEPD46%
GearboxDatabase16%
Motor 45 kWDatabase9%
46%of the result from primary data
Products (PCF)PCF add-on module
The bill of materials shows for each component the factor, its source and the share of the footprint. If a component deviates from the material master, this is flagged on the component.
Include supplier EPDs per component
Override the factor per component, visibly flagged on the component
Every component with factor, source and share of the result.
The bill of materials shows for each component the factor, its source and the share of the footprint. If a component deviates from the material master, this is flagged on the component.
PCF add-on module
XLSXBOM.xlsx3 levels
Extruder EX-45
Drive unit
Motor 45 kWopen
Base frame
214 itemsrecognized · 3 to clarify
Products (PCF)PCF add-on module
You upload the bill of materials as Excel or CSV, single-level or multi-level. Material numbers are resolved via the material master.
Which stage carries the footprint? One bar shows it.
The result per unit appears broken down by stage: material, production, distribution, use, end of life, each with its share as a percentage.
PCF add-on module
To businessesTo consumers
Materialin the footprint
Productionin the footprint
Factory gate
Distribution
Use
End of life
Cradle-to-Gateends at the factory gate
Products (PCF)PCF add-on module
You state who the product is for. When selling to businesses, the footprint ends at the factory gate; for final products, distribution, use and end of life are added.
Intermediate or final product? The boundary sets itself.
You state who the product is for. When selling to businesses, the footprint ends at the factory gate; for final products, distribution, use and end of life are added.
PCF add-on module
Base frame · Round steel C45
Quantity per unit1,450 kg
Loss / scrap5%
Factor1.84 kg CO₂e/kg
1,450 kg×1.05×1.84
2,801 kg CO₂eincl. 5% offcuts
Products (PCF)PCF add-on module
For each component you enter the quantity and the loss as a percentage. The offcuts go into the calculation, the formula is shown below.
The raw material is accounted for, not just the finished part.
For each component you enter the quantity and the loss as a percentage. The offcuts go into the calculation, the formula is shown below.
PCF add-on module
Electricity · by output mass
Hamburg plant324,000 kWh
Product share15.1%
Units per year120
324,000×15.1%÷120
408 kWhper unit · shown in the report
Products (PCF)PCF add-on module
For each energy line you choose the allocation basis. today.green shows the calculation from site consumption down to the unit and carries it into the report.
This product only, by output mass or a custom share
A custom share requires a rationale
Primary data from your sites, without entering it twice
How much plant electricity goes into one unit? The calculation is right there.
For each energy line you choose the allocation basis. today.green shows the calculation from site consumption down to the unit and carries it into the report.
PCF add-on module
Usage
1.2 kWh × 2,000 uses2,400 kWh
End of life · plastic
Recycling70%
Incineration30%
100%of disposal routes documented
Products (PCF)PCF add-on module
For final products you record the energy during use and the disposal routes per material stream. If a stage does not apply, you record the rationale.
Use: energy per use times number of uses
End of life: recycling, incineration, landfill, composting
From result to version: every report has the same structure.
The PCF report follows eight fixed chapters and fills them from your product data. It discloses exclusions, allocation and the electricity method.
PCF add-on module
Weight check
According to file2,240 kg
From the components2,172 kg
Base frame · +12%check
1 deviationabove 10% found
Products (PCF)PCF add-on module
After you upload a multi-level bill of materials, today.green compares the stated weight of each assembly with the weight of its components. Deviations above 10% and above 1 kg appear in a list.
Confirm the difference as offcuts, with a rationale
The bill of materials checks itself: counted versus stated.
After you upload a multi-level bill of materials, today.green compares the stated weight of each assembly with the weight of its components. Deviations above 10% and above 1 kg appear in a list.
Analyze11
From the grand total down to the single entry.
Total 20261,240tCO₂e
−28% vs. 2024
S1Scope 1520 t
Stationary combustion310 t
CHP plant, hall 28.25 t
S2Scope 2280 t
S3Scope 3440 t
AnalyzeESG platform
The analysis shows your emissions by scope and category, compared across years. One click opens the entries behind them.
Total emissions, change, intensity
Tabs for consumption, hotspots and data quality
For ESG, management, controlling
Analyze
Scope analysis with drill-down
From the grand total down to the single entry.
The analysis shows your emissions by scope and category, compared across years. One click opens the entries behind them.
Driver breakdownin tCO₂e
−260 tfrom other factors
AnalyzeESG platform
The driver breakdown separates what comes from changed activity and what comes from other factors.
Largest sources first
Change between two years broken down
For ESG, management
Analyze
Hotspots and drivers
Where do the emissions arise, and why have they changed?
The driver breakdown separates what comes from changed activity and what comes from other factors.
Total 2026
1,240t−28%since 2024
Electricity · MWh
Intensity
51.7t per €M
Add widget
AnalyzeESG platform
Under “My Dashboard” you add widgets and arrange them by dragging. All of them read live from your sites.
Add widget
Arrange by dragging
For ESG, controlling, management
Analyze
Custom dashboards
Put together the analysis you need.
Under “My Dashboard” you add widgets and arrange them by dragging. All of them read live from your sites.
Next steps3 open
Sprinter-1: fuel receiptsOctober missing · due Nov 30
CHP plant, hall 2: meter readingQ4 · due Dec 15
Approve 4 entrieswaiting for your review
Open stepRecord electricity · HamburgRecord now
AnalyzeESG platform
The dashboard shows your next steps, upcoming deadlines and the key figures, for your account.
Continue open steps directly
Cover image per person from four motifs
For ESG, site teams, management
Analyze
Dashboard with next steps
After login, you see what comes next.
The dashboard shows your next steps, upcoming deadlines and the key figures, for your account.
Emission sources1 site selected
Divisions
Sales and administration331 t
Locations
Hamburg plant649 t
Essen warehouse260 t
649 tof 1,240 t · your selection only
AnalyzeESG platform
A filter narrows the analysis to one subsidiary, one division or one site.
One unit per selection
The selection is shown above the analysis
For ESG, management, site teams, controlling
Analyze
Analysis per unit
Region, company, division or site: every unit sees its own footprint.
A filter narrows the analysis to one subsidiary, one division or one site.
GHG intensity 2026
3.71tCO₂e
per employee1,240 t ÷ 334 full-time equivalents
per €M revenue51.7 t
Included10 of 10 categories
AnalyzeESG platform
You choose what to divide by: employees, revenue, production volume, floor area or a custom metric. You also see which categories are included.
Maintain reference values per year
Create custom metrics
All emissions or only Scope 1 and 2
For ESG, controlling, management
Analyze
GHG intensity with your own reference value
Emissions per employee, per revenue or per tonne of product.
You choose what to divide by: employees, revenue, production volume, floor area or a custom metric. You also see which categories are included.
Working from home, travel policy, heating temperature: what is the net effect?
You change processes instead of technology. The result is a net effect: savings and side effects are shown openly side by side.
Budget stress testoff track
Growth +2%Grid −4%Measures −3%
112%of the CO₂ budget to 2040
Targets & measuresESG platform
You adjust growth, electricity mix and measures and see whether your CO₂ budget holds up to the target year and in which year you leave the target pathway.
Does your CO₂ budget hold up to the target year, even as you grow?
You adjust growth, electricity mix and measures and see whether your CO₂ budget holds up to the target year and in which year you leave the target pathway.
Activity variationOutput +15%
S1Process heat310357 t
+15 %
S2Electricity240276 t
+15 %
S3Purchased goods260299 t
+15 %
7.5%needed per year · previously 5.3%
Targets & measuresESG platform
You vary production, workforce or fleet per category and see how much more you need to cut each year to stay on target.
today.green distributes your reduction target according to each site's share. Every site manager sees where the site stands today and where it should be in 2030.
The company target becomes a target value for every site.
today.green distributes your reduction target according to each site's share. Every site manager sees where the site stands today and where it should be in 2030.
Gap to the 2040 target
233 t through your plan87 t remaining
Switch to green electricity tariff−180 t
Heat pump instead of gas boiler−53 t
73%of the gap closed
Targets & measuresESG platform
The platform shows the gap between your plan and the target pathway. You add measures to the plan one by one, and the cost curve shows the cheapest first.
You see the gap to the target and what your plan already closes.
The platform shows the gap between your plan and the target pathway. You add measures to the plan one by one, and the cost curve shows the cheapest first.
GHG report & metrics7
One dataset for the GHG report and every customer request.
Chapter 3Emissions by scope
S1S2S3
GHG Protocol Emissions report2026
Your logo
13 / 13 mandatory disclosures
ExportPDFWord
GHG report & metricsESG platform
The report is built directly in your layout with your current data. A checklist shows which mandatory disclosures under the GHG Protocol are still missing.
The report is built directly in your layout with your current data. A checklist shows which mandatory disclosures under the GHG Protocol are still missing.
Customer questionnaire · climate2026
S1Scope 1520 t
S2Scope 2 · market-based280 t
S3Scope 3440 t
ΣTotal1,240 t
4 of 4fields filled from your footprint
GHG report & metricsESG platform
This report type fills in the greenhouse gas metrics that customer and rating questionnaires ask for, from your footprint, with no retyping.
From the same data as your GHG report
For customers, banks and ratings
For ESG, product & sales, controlling
GHG report & metrics
Metrics for customer questionnaires
The greenhouse gas metrics that customers and ratings ask for.
This report type fills in the greenhouse gas metrics that customer and rating questionnaires ask for, from your footprint, with no retyping.
ESG platform · VSME · CSRD
Footprint 2026recorded once · as of Nov 121,240 t
GHG reportChapter 3synced
VSMEDisclosure B3synced
CSRDTopic E1synced
GHG report & metricsESG platform · VSME · CSRD
Emissions and energy are recorded once. Every report draws on the same values, with source and date of transfer.
No retyping between reports
Synced values are marked
For ESG, controlling
GHG report & metrics
Values straight from the footprint
One dataset for the GHG report, VSME, CSRD and customer requests.
Emissions and energy are recorded once. Every report draws on the same values, with source and date of transfer.
Report scope · Scope 31 excluded
3.1 Purchased goods
3.4 Transportation
3.6 Business travel
3.13 Leased assets
1 categoryexcluded · with justification
GHG report & metricsESG platform
You can only exclude a Scope 3 category from the report with a justification. If the justification is missing, the checklist flags it.
Exclusion per Scope 3 category
Justification is mandatory
Exclusion and justification disclosed in the report
Freeze a revision. Afterwards you see what has changed.
You freeze a revision and then filter for everything that has changed since. Findings are attached directly to the data point.
VSME add-on module
Report readiness
9 of 11 disclosures readyBasic module
B3Energy and GHGapproved
B8Workforceopen
Comprehensive module C1 to C9waiting
VSME & CSRDVSME add-on module
Report readiness shows how many disclosures are ready. The comprehensive part only goes into the report once every base disclosure is approved, not applicable or omitted with a reason.
Report readiness shows how many disclosures are ready. The comprehensive part only goes into the report once every base disclosure is approved, not applicable or omitted with a reason.
VSME add-on module
Requestability per disclosure
B3Energy and GHGup to 10 employees
C3Reduction targetsover 10 employees
Voluntarynot requestable
20 disclosureslabeled individually
VSME & CSRDVSME add-on module
Every data point is labeled: requestable up to 10 employees, above that, or not at all. So you know what business partners may request from you.
For every value you enter the prior year. If you adjust a comparative figure, the platform asks for a reason and calculates the difference from what was reported before.
Correct comparative figures, with a reason and the difference.
For every value you enter the prior year. If you adjust a comparative figure, the platform asks for a reason and calculates the difference from what was reported before.
CSRD add-on module
Platform data · E1
S1Fuelssynced
S2Total electricityoverridden
Energy consumptionsource changed
Restore from source
VSME & CSRDCSRD add-on module
Values from the footprint carry a source status. If someone overrode a value by hand or the source changed, it stands out. One click restores the value.
Synced, overridden or source changed: you see it on the value.
Values from the footprint carry a source status. If someone overrode a value by hand or the source changed, it stands out. One click restores the value.
Materiality & climate risk6
What is material for your company. And what is at stake at your sites.
Material climate risks appear automatically in the materiality assessment and in VSME C4, where they are locked against changes. In the CSRD you transfer the climate risk values with one click, with origin and timestamp.
Assessed once, used in materiality, VSME and CSRD.
Material climate risks appear automatically in the materiality assessment and in VSME C4, where they are locked against changes. In the CSRD you transfer the climate risk values with one click, with origin and timestamp.
CSRD add-on module
3.6 · Low-carbon technologies
Substantial contributionevidenced
Do no significant harmevidenced
Minimum safeguardsopen
242activities in the catalog
Materiality & climate riskAdd-on module CSRD
You pick your activities from the catalog, with suggestions by industry, and document the assessment steps per activity. You add turnover, CapEx and OpEx.
Pick activities from the catalog, document the assessment steps.
You pick your activities from the catalog, with suggestions by industry, and document the assessment steps per activity. You add turnover, CapEx and OpEx.
Todd AI5
Todd AI reads, suggests and drafts. You decide what gets accepted.
Add-on module VSME · CSRD
PDFCode_of_Conduct.pdfread
Suggestion from Todd AIG1
The code of conduct applies to all employees, with annual training.
Confidence high · 91%Found on p. 4
AcceptDiscard
Todd AIAdd-on module VSME · CSRD
Todd AI reads your documents and suggests values and texts per data point, with visible confidence and source. You accept or discard.
Upload policies. Todd AI suggests values and texts per data point.
Todd AI reads your documents and suggests values and texts per data point, with visible confidence and source. You accept or discard.
ESG platform · CSRD
2.1Standards and methodologyTodd AI
Our footprint follows the requirements of the GHG Protocol and covers all sites under our operational control.
Footprint per GHG Protocol, all sites under operational control.
AcceptDiscard
Todd AIESG platform · CSRD
Todd AI drafts a first text for chapters in the GHG report and for disclosures in the CSRD. In the CSRD, “Enhance text” shortens and polishes your own text according to fixed rules.
Todd AI writes the first draft. You decide what stays.
Todd AI drafts a first text for chapters in the GHG report and for disclosures in the CSRD. In the CSRD, “Enhance text” shortens and polishes your own text according to fixed rules.
Add-on module VSME · CSRD
Does this apply to all suppliers?
Yes. The code applies to all direct suppliers.Code_of_Conduct.pdf · p. 3
Ask Todd AI about your documents
Todd AIAdd-on module VSME · CSRD
In the chat you ask questions about the uploaded documents. Todd AI answers from those documents, as a suggestion you review.
You assign a data owner to every disclosure, per data point if needed. Returned data points land in their tasks.
Settings & security9
Who may see and change what. And how audited figures stay protected.
PKPeter KoblenzHamburg plant
LocationsCapture
ProductsViewer
SuppliersEditor
CSRD hidden
10 areasexactly one role per area
Settings & securityESG platform
Every person gets exactly one role per area: Viewer, Logger, Editor, Auditor or Admin, depending on what the area offers. Whatever isn't shared stays hidden.
Ten areas from the company map to the CSRD
Overview of what each role may do
Changeable per person at any time
For IT & admin, management, ESG
Settings & security
Roles and permissions per area
Who may do what, for each area separately.
Every person gets exactly one role per area: Viewer, Logger, Editor, Auditor or Admin, depending on what the area offers. Whatever isn't shared stays hidden.
Members
LRLena RichterSustainabilityAdmin
PKPeter KoblenzProductionEditor
WPAuditorsshared areas onlyExternal
EmailViewerInvite
Settings & securityESG platform
You invite members and assign them to departments. External parties such as the auditors see only shared areas.
Unlimited users
Access and role set in the invitation
Department stored per member
For IT & admin, management
Settings & security
Members, departments and external access
Invite your team. Give the auditors targeted access.
You invite members and assign them to departments. External parties such as the auditors see only shared areas.
Review queue2 waiting
Q3 electricity · Hamburg plant86,400 kWh · entered by Peter Koblenz
Entered
2Reviewed
3In the footprint
ApproveReject
Reviewer approval required
Settings & securityESG platform
With the review process switched on, new entries land in a review queue before they flow into the footprint.
Switched on and off in the Sites area
Reject with a reason
For controlling, ESG, IT & admin
Settings & security
Four-eyes principle
New entries only count once approved.
With the review process switched on, new entries land in a review queue before they flow into the footprint.
Reporting years
2024auditedlocked
2025auditedlocked
2026current yearLock
2 yearslocked · figures stay fixed
Settings & securityESG platform
You lock a closed year. Unlocking is possible only with a reason and only for admins.
Status visible per year
Every lock is in the audit trail
For controlling, ESG, IT & admin
Settings & security
Lock calendar years
Audited figures stay as they are.
You lock a closed year. Unlocking is possible only with a reason and only for admins.
Didn't find what you're looking for? The library shows a selection.
This page lists the platform's core features, not every single function. Ask us about your use case in the demo. As a customer you submit requests via the Feature Wishlist and track their status.
We use cookies and similar technologies to operate and improve this site. Necessary cookies are always active. Statistics cookies (Google Analytics) are only set with consent. The selection can be changed at any time via “Cookie settings” in the footer. More in our Privacy policy.
Cookie settings
Selection of the cookie categories we may set. Necessary cookies are required for operation and always active. More information in the Privacy policy.
Necessary
Required to operate the site (e.g. storing the cookie selection, security and session functions). Cannot be disabled. Legal basis: legitimate interest / contractual necessity (Art. 6(1)(b/f) GDPR, § 25(2) TDDDG).
Statistics
Pseudonymous reach and usage measurement with Google Analytics 4 so we can understand how the site is used and improve it. Active only with consent (Art. 6(1)(a) GDPR, § 25(1) TDDDG).






 Natural gas boiler